Friday, November 28, 2014

Exploring the Citrix XML 6.5 Broker in more detail

The Citrix XML broker actually relies on many pieces to ensure fast and proper operation. This CTX article describes the process for XenApp 6 (seems applicable to 6.5 as well).

The part that is relevant to the XML broker is steps 4-9.

4. The user’s credentials are forwarded from XML to the IMA service in HTTP (or HTTPS) form.

5. The IMA then forwards them to the local Lsass.exe.

6. The Lsass.exe encrypts the credentials and passes them to the domain controller.

7. The domain controller returns the SIDs (user’s SID and the list of group SIDs) back to Lsass.exe and to IMA.

8. IMA uses the SIDs to search the Local Host Cache (LHC) for a list of applications and the Worker Group Preference policy for that authenticated user.

9. The list of the applications together with the user’s worker group preference policy are returned to the Web Interface.


So what does this look like (click to blow it up)?


Starting with packet #32 we see the initial POST request for a list of applications.


<?xml version="1.0" encoding="UTF-8"?><!DOCTYPE NFuseProtocol SYSTEM "NFuse.dtd"><NFuseProtocol version="5.4"><RequestAppData><Scope traverse="subtree"></Scope><DesiredDetails>permissions</DesiredDetails><ServerType>all</ServerType><ClientType>ica30</ClientType><ClientType>content</ClientType><Credentials><UserName>trententtye</UserName><Password encoding="ctx1”>PASSWORDLOL</Password><Domain type="NT">HEALTHY</Domain></Credentials><ClientName>WSCTXAPP301T</ClientName><ClientAddress addresstype="dot">10.132.169.130</ClientAddress></RequestAppData></NFuseProtocol>


Steps 5, 6 and 7 are packets 36-86.  LSASS goes back to AD to grab the SID's.


Step 7.5: It appears that the first time you enumerate applications on a broker that information is queried to the SQL database and stored in the local host cache.  This would be packets 87-94.  Additional queries done do not show this traffic.

R JoinIndexSearch2 & & & 4 0 & imalock 8nodeid & uidhost & uidtype & uidid & contextid rdn " KEYTABLE data 
 | 
 &7cb1-0192-00000a90 dummy textptr dummyTS 
 1 PolicyObjectClass 9 ATTRIBUTE-uid uidvalue 
 |3 ATTRIBUTE-imadn css * & 7cb1-0192-00000a90 A ATTRIBUTE-contextID uint32 E ATTRIBUTE-updateCount uint32 Name cis R N Application-Millennium-Failover-Policy + Description css R N Application Millennium Failover Policy ) Version uint32 + Priority uint32 ' 
Enabled uint8 - 
ExtEnabled uint8 1 
FilterByUser uint8 G 
AllowAuthenticatedUsers uint8 ? 
AllowAnonymousUsers uint8 9 
FilterByClientIp uint8 ; 
AllowAllClientIps uint8 = 
FilterByClientName uint8 ? 
AllowAllClientNames uint8 G 
FilterByAccessCondition uint8 ? 
AccessConditionFlag uint8 [ WorkerGroupPreferenceAndFailover uint32 A StreamedAppDelivery uint32 _ StreamedAppDelivery!DeliveryOption uint32 { WorkerGroupPreferenceAndFailover!WorkerGroupUidList css \ * 1=7CB1-0350-00000A8C * 2=7CB1-0350-00000A8E C AccessSessionConditions css 1 DeniedNameList css 3 AllowedNameList css - DeniedIpList css / AllowedIpList css ) DeniedList css + AllowedList css 0X2/NT/HEALTHY/S-1-5-21-38857442-2693285798-3636612711-15112741 0X2/NT/HEALTHY/S-1-5-21-38857442-2693285798-3636612711-15112748 0X2/NT/HEALTHY/S-1-5-21-38857442-2693285798-3636612711-15112746 0X2/NT/HEALTHY/S-1-5-21-38857442-2693285798-3636612711-15112752 y 


Lastly, step 9 is all the traffic we see after packet 95 in red; the return of the XML data.  For our setup, our XML brokers responded with the following timings:

Step 4: 1ms
Step 5: 2ms
Steps 6 and 7: 47ms
Step 7.5 (DB query is not in LHC): 2ms
Step 8: 14ms
Step 9: 14ms

Total: 80ms

With a freshly created LHC this is what process monitor sees:

Again, the IMASrv.exe will actually NOT be present in this list if you have executed at least one query against the XML broker as it is only displayed when it queries the database (wssql011n02) and stores the response in the LHC.

So, what could contribute to slow XML broker performance?

Utilizing the WCAT script we can continuously hammer the XML broker with however many connections we desire.  The XML brokers have a maximum of 16 threads to deal with the incoming traffic but at 80ms per request/response the queue would have to get fairly long to create a noticeable performance impact.  In addition, previous tests on the 4.5 broker showed additional CPU's help improve the performance of the XML broker, I think the 6.5 broker shows better performance with lesser CPU's.

Utilizing the bandwidth emulator, clumsy, I'm going to simulate some poor network performance on the XML broker to see what the effects will be of how XML response times will vary.  The only network hits I can see are from the source (Web Interface), Active Directory, and (potentially) the SQL database.

Just starting the clumsy software with it's filtering by IP capabilities added about 800ms to the total roundtrip time.  Something to consider with other network management/threat protection software I imagine...


Anyways, adding just 20ms of lag to and from the web interface to the XML broker increased processing time by another 500ms of total time.  That is, 1500ms on the low end on 2200 on the high.  Increasing packet latency to 100ms brought the total processing time to 2700ms on the lowend and 3800ms on the high end.  I think it's safe to say that having the web interface and XML brokers beside each other for the lowest possible latency is a big performance win.

Targeting Active Directory with a latency of 20ms brought times from 420ms to 550ms.  Increasing that to 100ms brought the response times put to 890ms.  Not too shabby.  Seems AD is more resilient to latency.

Targeting the SQL database with a latency of 100ms showed the first query after the LHC was rebuilt went to 600ms and then back down to 420ms there after.  Locality to the database seems to have the lowest impact, but the 100ms lag did increase the LHC rebuild time to about 3 minutes from near instantly before.
I did try to test a heavy disk load against the XML broker but I was running this server with PVS with RAMDisk Cache overflow enabled which means my LHC is stored in RAM and no matter how hard I punted the C drive I couldn't make an impact.

Best Windows Network Bandwidth Simulator Emulator Jitter Latency software

It's called Clumsy.  It's really good.  It's a portable application, no installation necessary,   It's the best Windows Network Bandwidth Emulator Simulator software out there currently.

Thursday, November 27, 2014

Load testing Citrix XML broker

Previously, we encountered performance issues with the Citrix Web Interface due to our user load.  I devised a test using the Microsoft WCAT to hammer the web interface servers.  We found that after removing the ASPX processing limitation, logins were slow and we found that some XML brokers were taking a long time to respond.

I've been tasked with finding out why.  The Citrix XML server is a basic web server that takes an XML post, processes it and spits back a XML file in response.  To test the performance of the XML server I created a PowerShell script to send the same XML request that occurs when you login through the web interface.

XML-Test.ps1:

$i=1
for ($i -le 5; $i++) {

$csv = import-csv list_of_xml.csv

$output = @();

foreach ($server in $csv) {
$serverName = $server.Broker
$serverPort = $server.Port


$uri = "http://{0}:{1}/scripts/wpnbr.dll" -f $serverName, $serverPort

$soap = @'
<?xml version="1.0" encoding="UTF-8"?>
<!DOCTYPE NFuseProtocol SYSTEM "NFuse.dtd">
<NFuseProtocol version="5.4">
    <RequestAppData>
        <Scope traverse="subtree"></Scope>
        <DesiredDetails>permissions</DesiredDetails>
        <ServerType>all</ServerType>
        <ClientType>ica30</ClientType>
        <ClientType>content</ClientType>
        <Credentials>
            <UserName>trententtye</UserName>
            <Password encoding="ctx1">PASSWORDLOL</Password>
            <Domain type="NT">HEALTHY</Domain>
        </Credentials>
        <ClientName>WI_Sl2G71be93Q-ZNqOk</ClientName>
        <ClientAddress addresstype="dot">10.133.74.215</ClientAddress>
    </RequestAppData>
</NFuseProtocol>
'@

$numberOfThreads = Get-counter -Counter "\Citrix MetaFrame Presentation Server\Number of XML threads" -ComputerName $serverName
$numberOfBusy = Get-counter -Counter "\Citrix MetaFrame Presentation Server\Number of busy XML threads"  -ComputerName $serverName

#$command = Invoke-WebRequest $uri -Method post -ContentType "text/xml" -Body $soap
$results = measure-command {[xml]$WF = Invoke-WebRequest $uri -Method post -ContentType "text/xml" -Body $soap -TimeoutSec 120 -UseBasicParsing -UserAgent ""}
#$WF
$date = get-date
$date = "{0} {1}" -f $date.ToShortDateString(), $date.ToLongTimeString()
$output += "{0},{1},{2},{3},{4},{5}" -f $date,$serverName, $serverPort, $results.TotalMilliseconds, $numberOfThreads.CounterSamples.CookedValue, $numberOfBusy.CounterSamples.CookedValue
write-host $date,$serverName, $serverPort, $results.TotalMilliseconds, $numberOfThreads.CounterSamples.CookedValue, $numberOfBusy.CounterSamples.CookedValue
}


sleep 1

$output | out-file -append "\\wsctxapp301t\d$\WI_Load_Testing\OutFile.txt"

}


The list_of_xml.csv looks like this:
Farm,Broker,Port
farm,wsctxrshipxml1,80

The output of the file looks like so:

11/26/2014 3:34:29 PM,wsctxrshipxml1,80,312.197
11/26/2014 3:34:30 PM,wsctxrshipxml1,80,345.0929
11/26/2014 3:34:31 PM,wsctxrshipxml1,80,255.165
11/26/2014 3:34:33 PM,wsctxrshipxml1,80,294.3027
11/26/2014 3:34:34 PM,wsctxrshipxml1,80,300.1806

The times are in milliseconds on the far right.

Utilizing this information, we can gather how quickly the XML brokers respond and using this as a baseline we can start to load test to see the impact of how quickly the XML brokers will respond.

To do this, we go back to WCAT.  I set my XML.ubr file like so:

scenario {
    warmup    = 300;
    duration    = 300;
    cooldown    = 30;
    default {
        setheader {
            name    = "Connection";
            value    = "keep-alive";
        }

        version    = HTTP11;
        statuscode    = 0;
    }

    transaction {
        id = "PNA";
        weight = 1000;
        request {
            id = "1";
            url = "/scripts/wpnbr.dll";
            verb = POST;
                        port = 8080;
            postdata = "<?xml version=\"1.0\" encoding=\"UTF-8\"?><!DOCTYPE NFuseProtocol SYSTEM \"NFuse.dtd\"><NFuseProtocol version=\"5.4\"><RequestAppData><Scope traverse=\"subtree\"></Scope><DesiredDetails>permissions</DesiredDetails><ServerType>all</ServerType><ClientType>ica30</ClientType><ClientType>content</ClientType><Credentials><UserName>trententtye</UserName><Password encoding=\"ctx1\">PASSWORDLOL</Password><Domain type=\"NT\">HEALTHY</Domain></Credentials><ClientName>WSCTXAPP301T</ClientName><ClientAddress addresstype=\"dot\">10.132.169.130</ClientAddress></RequestAppData></NFuseProtocol>";
            setheader {
                name = "Content-Type";
                value = "text/xml";
            }
            setheader {
                name = "Connection";
                value = "Keep-Alive";
            }
            setheader {
                name = "Host";
                value = "wsctxrshipxml1";
            }
        }
    }
}

I then started the 
start "" wcclient.exe localhost

And let it roll.  When monitoring the server the process that takes up the most time is the IMASRV.EXE.  I imagine that is because the XML service is really just a simple web server that accepts the traffic and hands it off to the IMASRV.exe to actually process and gets the response back and sends it back to the requestor.

Started load testing at 11:49:00.  After 40 concurrent connections XML service is responding to requests at 2000ms per request.
With this testing we can now try to improve the performance of the XML broker.  We monitored one of our brokers and made some changes to it and reran the test to see the impact.  The largest positive impact we saw was adding CPU's to the XML brokers.  The following graphs illustrates the differences we saw:


I stopped the graph at around 20,000ms for responding to XML request for the top graph, and the maximum number of concurrent connections for the bottom graph at 3,000ms.  3,000ms would be very high for XML enumeration in my humble opinion, but still tolerable.  On a single CPU system, XML enumeration can only sustain about 12-15 concurrent requests before it tops out, 2 CPU systems do slightly better at 24-28 concurrent requests and 4CPU at 60 concurrent requests.  8 CPU's and we exceed 3,000ms at 120 concurrent requests.  Ideally, you would keep all requests under 1,000ms, which for 8 CPU is at 30 concurrent sessions, and 21 sessions for 4CPU.  1 CPU can only sustain about 2 concurrent requests to stay under 1,000ms while 2 CPU can sustain about 5 concurrent requests.

Again, this is the same query that the web interface sends when you login to a farm.  So if you have 10 farms and they all take 1,000ms to respond to an XML request you will sit at the login screen for 10 seconds.  Storefront allows parallel requests which would reduce the time to 1 second (potentially) but for Web Interface (and even Store Front), having an optimized XML broker configuration is ideal and, apparently, is very dependent on the number of CPU's you can give it.  Recommendation:
As many as possible.  Unfortunately, I did not have the ability to test 16 or 32 core systems but for an Enterprise environment, I would try to keep it at 8 as a minimum.

Optimizing Citrix Web Interface 5.4

My previous post detailed testing the limits of your Citrix Web Interface.  During this testing we discovered there appeared to be a limit on the number of connections the Citrix Web Interface could accommodate.  This discovery masked the true limitation: the Citrix Web Interface is limited by the number of threads its w3wp.exe process can spawn to handle ASPX pages.  The w3wp.exe process spawn threads to handle the number of connections/load and once it exceeded 48 threads then further requests go into the application queue.  This limitation exists when running a ASP.NET application under ASP.NET 2.0 in Classic mode.  In integrated mode this limitation is determined differently and not applicable.  Unfortunately, the Citrix Web Interface runs in Classic mode under ASP.NET 2.0.


This formula is determined by the number of CPU's you have times an arbitrary number Microsoft decided would be good for dealing with ASPX pages set back in the IIS 5 or IIS 6 days.  It is woefully low and sadly, Citrix does not resolve it when you install the Web Interface application.

But, we can increase the per processor thread count to prevent the queuing.  To do so you must edit the "C:\Windows\Microsoft.NET\Framework\v2.0.50727\CONFIG\machine.config" and set the processModel with a new set of thread values.


The values are MaxWorkerThreads, MaxIoThreads, MinWorkerThreads and MinIoThreads.  All values are set * the number of processors you have and are *per w3wp.exe process*.  So if you have a XenApp website and services site running on separate application pools each process then has a 1000 thread limit on a 2 processor system.  When we implement these we found we could hammer the web interface and the ASPX pages would consistently respond without issue.  We did find that hammering the web interface with 1000 threads then revealed a new performance limitation.  Though the ASPX pages were being processed so the explicit login page now constantly appeared without issue, we found that logging in and showing the applications was now slow, taking several dozen seconds at times.  By allowing our web interface to process more connections and pass those connections on; some of our dedicated XML brokers were having issues keeping up with the requests.

My next post will detail testing the capabilities of the XML server and seeing if we can determine the best way to optimize XML performance.

Sunday, November 23, 2014

Slow Citrix Web Interface 5.4 on ASPX pages (or how to load test your WI)

We've been having issues with our Citrix Web Interface (5.4.2) with it cratering to the point that you cannot even get to the explicit logon page, stuck on SilentDetection.aspx or another aspx page.

One Moment Please...  This screen takes minutes to resolve

So what could be causing this?  More often than not, it's a broken XML broker that isn't responding in a reasonable amount of time.  But XML brokers don't come into play with 'Explicit Logon', especially if you can't even get to the logon page.  In our scenario, we have two production Citrix Web Interface servers which are load-balanced in a round-robin scenario.

So I theorized that what's happening is we are experiencing a load issue.  That is our server cannot handle the number of connections that we our clients and PNA agents are producing.  How can we prove this out?  How many connections can our web interface accept?

To test out what the maximum number of connections our web interface servers can sustain I came up with a plan.  We need to thoroughly exercise the ASP.NET scripts that Citrix has put together for the web interface.  To do that we need I decided that logging in via explicit logon, skipping client installation (so client detection occurs) and then application enumeration.  This sequence hits the following ASPX pages:


The timeline of processing the aspx pages of a unloaded server looks like this:


The initial silentDetection.aspx's take the majority of the processing time, about 4.3 seconds.  To create the ability to simulate this load, Microsoft has a tool called "WCAT", or the Web Capacity Analysis Tool.  This tool allows you to setup "scenario's" which are a sequence of HTTP actions (GET/POST/etc) which simulates each step of the sequence above.  To record this sequence for WCAT, you need to install Fiddler 2 then install the WCAT scenario creator.  There are numerous WCAT scenario creators, but I used this one.  To create the scenario do the following:


1) Launch Fiddler 2 and click 'Launch'


2) Go through your login sequence on your web server until you hit the page with application enumerations.


3) Go back to Fiddler 2 and at the bottom of the screen on the left in the black bar, type "wcat reset"


4) Go Edit > Select All.  Then in the black bar, type 'wcat addtrans'


5) Lastly, type 'wcat save'.


This will create a fiddler.wcat file in your C:\Program Files (x86)\Fiddler2 directory.


You can now open this file as a text file to see the scenario you just created.  One of the issues with this WCAT scenario creator you will need to fix up some cookie values.  Some cookie values are captured exactly as described, which has some issues as double quotes need to be escaped in the scenario file.

So, for example, this line:
value = "WIUser="CTX_ForcedClient#Off~CTX_LaunchMethod#Ica-Local~CTX_AuthMethod#Explicit~CTX_CurrentFolder#%7bAllResources%3d%5c%7d~CTX_ViewStyle#%7bAllResources%3dIcons%7d"; WINGDevice="CTX_DeviceId#WI_YxJYRT6LZxvCnDWTF"";

Won't work.  You need to escape out the double-quotes with a back-slash so it looks like so (the backslashes are bolded and underlined):

value = "WIUser=\"CTX_ForcedClient#Off~CTX_LaunchMethod#Ica-Local~CTX_AuthMethod#Explicit~CTX_CurrentFolder#%7bAllResources%3d%5c%7d~CTX_ViewStyle#%7bAllResources%3dIcons%7d\"; WINGDevice=\"CTX_DeviceId#WI_YxJYRT6LZxvCnDWTF\"";

Once you've escape'd the double quotes, save the file as 'scenario.ubr'; you can now setup WCAT.  

Install WCAT on some test boxes or a single box (for the purposes of this demo I'm doing just a single box).

Copy over your scenario.ubr to the C:\Program Files\wcat folder.  I took the settings.ubr file from the Samples directory in the wcat folder and put it in the root of the wcat folder as well.  


You then need to start the controller and attach clients to this server.  Open a command prompt to the wcat directory.  The command line I used for the controller is:
wcctl -t scenario.ubr -f settings.ubr -s wsctxwi01t -c 20 -v 20 -w 300 -u 300 -n 100

the values are:
-c = # of clients to connect to this controller.
-v = # of virtual clients to launch per client
-w = warm up time before all clients are connected
-u = duration of testing
-n = cooldown period for clients to disconnect.

Since I'm testing from one computer I then used the following command to start all my clients:

for /l %A IN (1,1,20) do (start "" wcclient.exe localhost)

The 20 clients connect and start loading the server, following the sequence we recorded earlier.

If you want to monitor to see where your maximum user load is vs. maximum performance (e.g., near instant speed), go to your web interface server and create a data collector set with the following counters:


Without any clients connected, start your data collector, then start the WCAT load testing.

This is what I see with regards to our load:


You can see around 220 current connections the Requests in Application Queue shoots up.  At this point any additional requests to ASPX files goes into a queue that makes the website appear 'frozen' which it waits for the ASPX file to be processed and sent down to you.  Citrix attempts to 'hide' this page by loading the 'loading.htm' during ASPX processing.  This page is your 'One Moment Please' page.  If you show the Request Execution Time counter, we can see the longest time taken to process a ASPX page:


In my example here, the longest time it took to process a ASPX page was is the lighter pink line.  The longest time was 14 seconds.


The Request Wait Time is how long it takes of while you wait in the queue for the ASPX page to be processed.  So the dark blue line with the spike in the bottom right was a 16 second wait time, waiting for my page to start processing, and with the request execution time being 14 seconds this particular request may have taken 30 seconds in total.

With this information we can fairly accurately determine that we would want to keep the number of current connections to around or under 150 just to keep a safe buffer.  To do that, we could increase the number of web interface servers or break out our web server to different Application Pools.  Our Citrix web interface was originally designed with a monolithic application pool and our PNA website and other websites all run under one process.  In our situation, we could exceed our connection limit during times when Citrix Receiver checks in to enumerate applications at the same time as users trying to use the web site.  If we break the PNA website to a new application pool then we can actually double the number of connections we can process at any one time.  The limit appears to be the w3wp.exe ability to process ASPX pages.  By adding another application pool it actually creates another w3wp.exe process and if we max out the connections on one of the websites the other website/process will continue to work without issue.

Monday, November 17, 2014

AppV 5 first launch application performance

Our AppV 5 environment is a full infrastructure implementation.  We utilize the management/streaming server to pull the applications down to our Citrix XenApp 6.5 servers.  Our XenApp servers are Citrix PVS servers, we enable the Cache on RAM with disk overflow and the write-cache intermediate mode.  To maximize CPU performance we have our ESXi hosts set to maximum performance and disable power management in the BIOS of the hosts.  We have some applications that are very latency sensitive and the switching of power states on the ESXi hosts have caused performance degradation so we have power management disabled.  We have setup our PVS servers with the secondary D:\ WriteCache disk where we fully mount the AppV 5 packages, removing the streaming latency that going over a network may add.

Because of some performance concerns with the Shared Content Store (SCS) I was tasked with coming up with a way of determining if there is a performance impact of switching from fully mounted applications.  In order to determine the impact my plan was to measure a baseline based on disk performance.  Our SMB share that we are storing our .appv packages actually has the same performance as the local disk.  Since AppV packages are immutable, the only performance consideration we should be concerned is READ performance from the SMB share compared to the local disk.  The writes occur in the %userprofile%\appdata\vfs which is stored on the C:\ drive.  The Cache to RAM with disk overflow feature would ensure that write performance into those directories are fast and should be near instant.

With that said, I've used the diskspd.exe application (new from Microsoft) to measure performance. AppV 5 utilizes a 64KB allocation size so that's what we'll set as our -b value.  We'll measure Latency statistics comparing local disk to the file share as well.

D:\diskspd.exe -c1G -b64K -L -d60 D:\test.dat
D:\diskspd.exe -c1G -b64K -L -d60 \\citrixnas01\ctx_images_test\test.dat

Results:
D:


SMB share:


D:
Read IO
thread |       bytes     |     I/Os     |     MB/s   |  I/O per s |  AvgLat  | LatStdDev |  file
-----------------------------------------------------------------------------------------------------
     0 |     83828801536 |      1279126 |    1332.13 |   21314.08 |    0.045 |     0.138 | D:\test.dat (1024MB)
-----------------------------------------------------------------------------------------------------
total:       83828801536 |      1279126 |    1332.13 |   21314.08 |    0.045 |     0.138

SMB:
Read IO
thread |       bytes     |     I/Os     |     MB/s   |  I/O per s |  AvgLat  | LatStdDev |  file
-----------------------------------------------------------------------------------------------------
     0 |     80124379136 |      1222601 |    1273.26 |   20372.15 |    0.096 |     0.105 | \\citrixnas01\citrix_test\test.dat (1024MB)
-----------------------------------------------------------------------------------------------------
total:       80124379136 |      1222601 |    1273.26 |   20372.15 |    0.096 |     0.105


Performance of the SMB share vs local disk:
MB/s: 96%
IO per s: 96%
AvgLat: 46%

Based on these results, the local disk appears to be nearly identical to the SMB share with the average latency a little more than half on the local disk.  Although it's half on average, we are still in the sub 1ms time range which is significantly faster than you could get with a physical server with a single local disk.

The next test I have is launching an application and getting to the splash screen to see how long it takes to load.  For this test I've written a AutoIt script that takes two parameters, the name of the program to launch and the window title to monitor for.

#Region ;**** Directives created by AutoIt3Wrapper_GUI ****
#AutoIt3Wrapper_Change2CUI=y
#EndRegion ;**** Directives created by AutoIt3Wrapper_GUI ****
;
; AutoIt Version: 3.0
; Language:       English
; Platform:       Win9x/NT
; Author:         Trentent Tye (trentent@ca.ibm.com)
;
; Script Function:
;   This script takes 2 parameters.  The first is the program to launch; second is the window we wait for then output
;   standard output with the duration both took.
#include

$progToLaunch = $CmdLine[1]
$windowToWaitFor = $CmdLine[2]

Local $hTimer = TimerInit()
Run($progToLaunch)

WinWaitActive($windowToWaitFor)
Local $fDiff = TimerDiff($hTimer)
Local $Time = _NowTime()

ConsoleWrite($Time & "," & $fDiff & "," & $windowToWaitFor & "," & $progToLaunch & @CRLF)

;finished


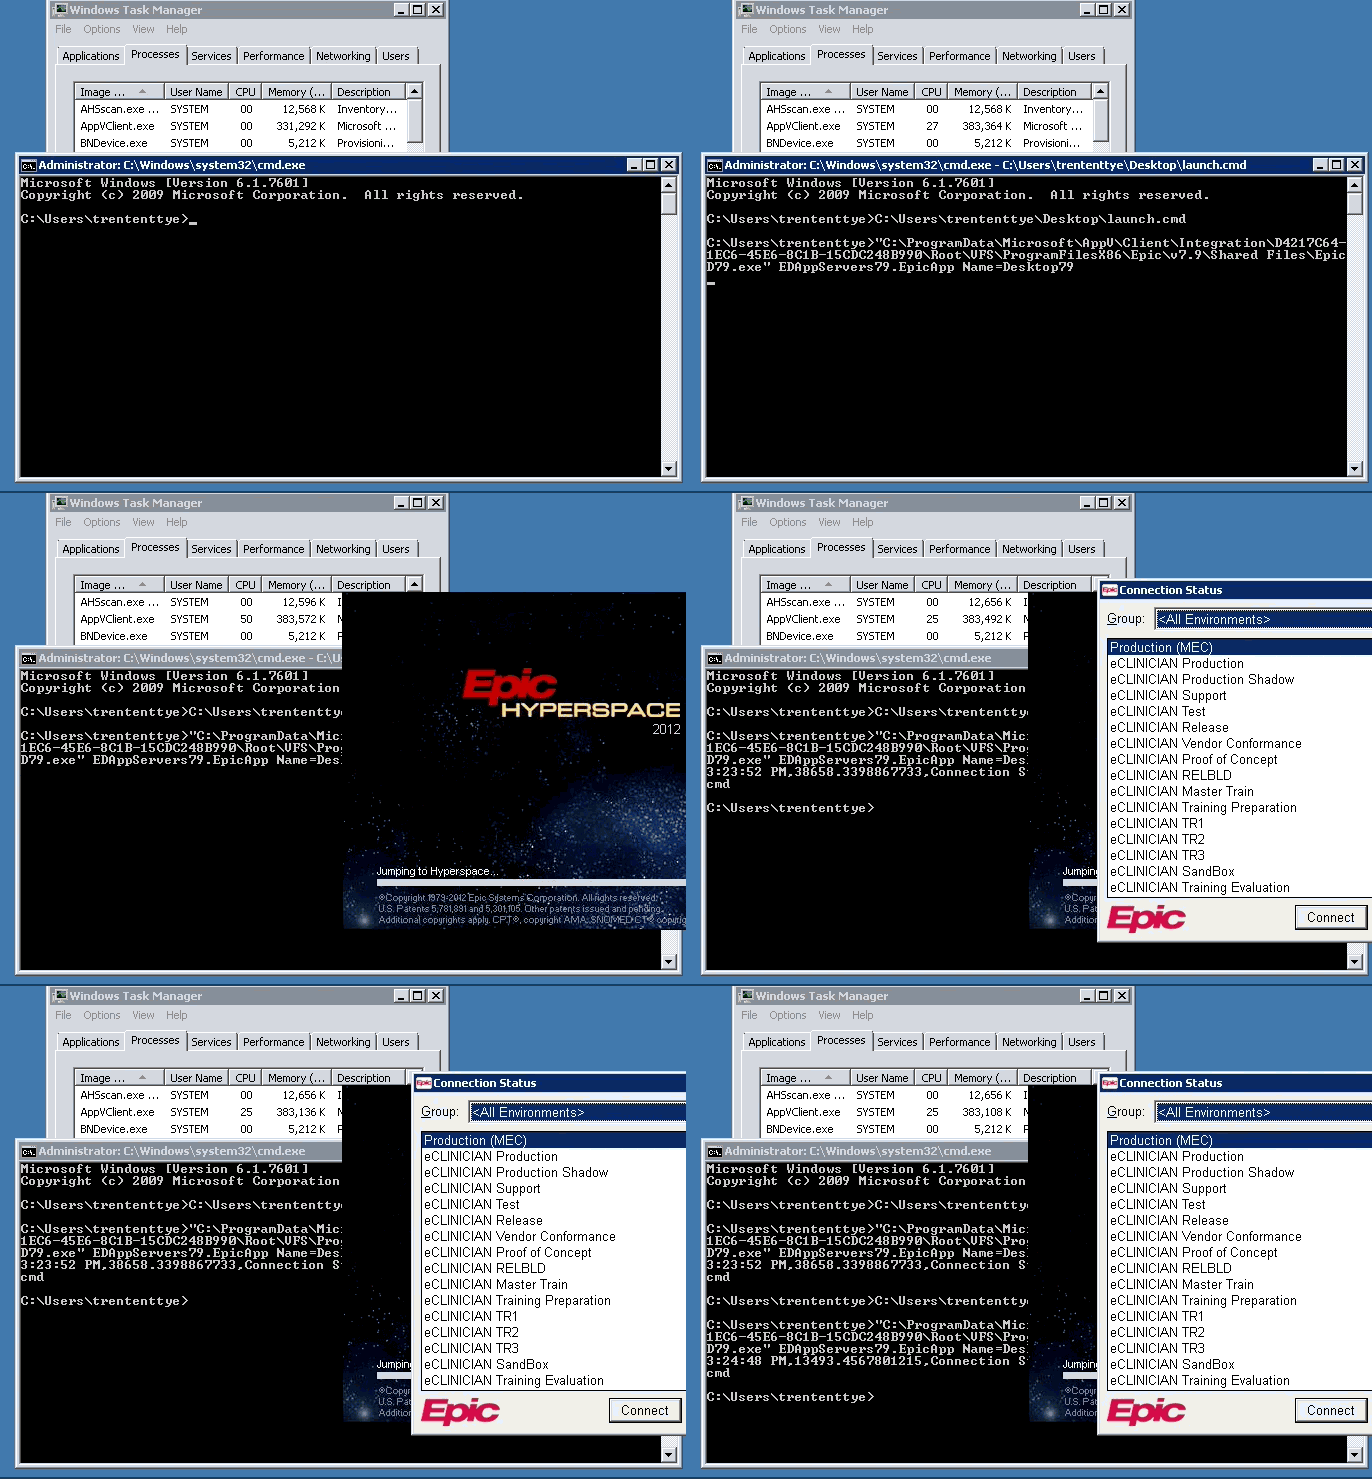
I setup a cmd file with my program (Epic) because it takes some parameters prior to launch.  I then pointed my timer application at it.

C:\timer.exe D:\AppVPerfTest\epic.cmd "Connection Status"

The results (with SCS):
Net Stop / Net Start AppvClient
10:05:20 AM,196229.360505316,Connection Status,D:\AppVPerfTest\epic.cmd
10:05:51 AM,13964.6012970922,Connection Status,D:\AppVPerfTest\epic.cmd
10:05:59 AM,12841.0388750526,Connection Status,D:\AppVPerfTest\epic.cmd
10:06:03 AM,12334.0792614704,Connection Status,D:\AppVPerfTest\epic.cmd


The columns are Time Completed, Duration (in ms), Window to check for, Command executed.

After doing a Net Stop AppvClient / Net Start Appclient and then executing our AppV application it takes 196 seconds to start the application.  After that initial launch it takes 12-15 seconds to start.  Something is really dragging our initial application launch time down.  I've found if I stop/start the service I need to do a add/publish via Powershell for that application to reduce the 196 seconds.  This then takes first launch down to 48 seconds.  This is how long is takes to start the same application after a system restart:

3:25:41 PM,48195.8385074081,Connection Status,D:\AppVPerfTest\epic.cmd
3:27:26 PM,12646.0290344164,Connection Status,D:\AppVPerfTest\epic.cmd
3:27:45 PM,15450.5886222970,Connection Status,D:\AppVPerfTest\epic.cmd
3:28:00 PM,12488.5766906129,Connection Status,D:\AppVPerfTest\epic.cmd

First launch time after restart is 48 seconds then subsequent launches are essentially identical to just the stop/start appvclient service + add/publish.  Which makes sense as our AppV5_Data_Precache script does a add/publish.  Evidently, we're going to have to go further into AppV to understand what's causing it to take so long.  To start, I'm going to detail our package a bit.

The application I'm testing this with is Epic.  It's a huge application.  AppXManifest is 72MB, FilesystemMetaData.xml is 1.7MB, Registry.Dat is 62MB.


It contains 22,000 files totalling around 2GB in size.


When AppV is "launching" the application for the first time it starts consuming memory and CPU for the 196 seconds that it's launching, peaking at nearly 600MB RAM and 50% CPU (though most of the time it's peaked at 25% CPU).

AppV utilization before application launch

Start of application launch

Peak during launch
Application launched
The AppV Debug logs do not give a whole lot of info as to what AppVClient.exe is doing during this time.  Most of the logs show the application "start" as they setup their components, and when the application has launched.  Almost all the logs show the first second or two of application launch and the last second or two before the GUI.

I launched the application at 12:36:24, it finally displayed the GUI at 12:39:38

The only log that shows data during the entire time is the SHARED PERFORMANCE log.  Unfortunately, the log is undecipherable to me.


Lots of PreCreate, PreCleanup, PreAcquireForSection with no relevant data.

Perfmon.exe doesn't do a whole lot better with large gaps between file/process/network accesses:
What is it doing between 1:17:41 and 1:18:29?  CPU is pegged but no disk activity

Showing Registry accesses also shows huge gaps between the AppVClient.exe process accessing the system.
Registry information still shows huge gaps in time where the AppVClient.exe is processing

So I'm not sure what the hold up is with regard to the delay for this application.  None of the usual tools I use to monitor performance is giving me any hints or indications of why it's delaying launch.


First launch delay when stopping/restarting AppV service.
Total time is 221s for the first launch, 15s for subsequent launches


First launch delay when starting application after a full system restart.
Total time is 38s for first launch then 13s for subsequent launches.